
I Tracked Every Deep Value Report I Published. Here Is What Happened.
105 reports, 67 companies, 864 price observations—and a few uncomfortable lessons.


I remembered the winners first.
Centene. Hudson Pacific. American Outdoor Brands. Xerox.
Cable One came back just as quickly. Some losses do not need a spreadsheet to remain fresh in your mind.
What I could not remember was everything in between.
Since August 2025, I have published more than one hundred Deep Value Reports. Some stocks moved almost immediately. Others sat there for months. A few kept falling long after I believed the bad news had already been reflected in the price.
Looking back from memory was useless. Winners become cleaner with time. Mistakes acquire explanations. The large middle, where most of the work actually lives, slowly disappears.
So I went back and measured every report.
The database now covers 105 publication events across 67 companies, with 864 completed price observations from the publication date through each available monthly anniversary. Some companies appeared more than once because every new report or major update was measured from its own publication date. Every publication stayed in the record: the winners, the mediocre ideas, the repeated theses and the ones I would rather forget.
The results were encouraging. They were also less flattering, and far more useful, than I expected.
One Week Was Too Soon to Tell
After one week, the median stock had gone nowhere. Exactly half of the reports were positive. The other half were negative.
There was no visible short-term advantage. Publishing a Deep Value Report did not identify a stock that was suddenly ready to move the following morning.
Each row below shows what the median stock had returned by that point after publication. It does not represent the return of a portfolio.
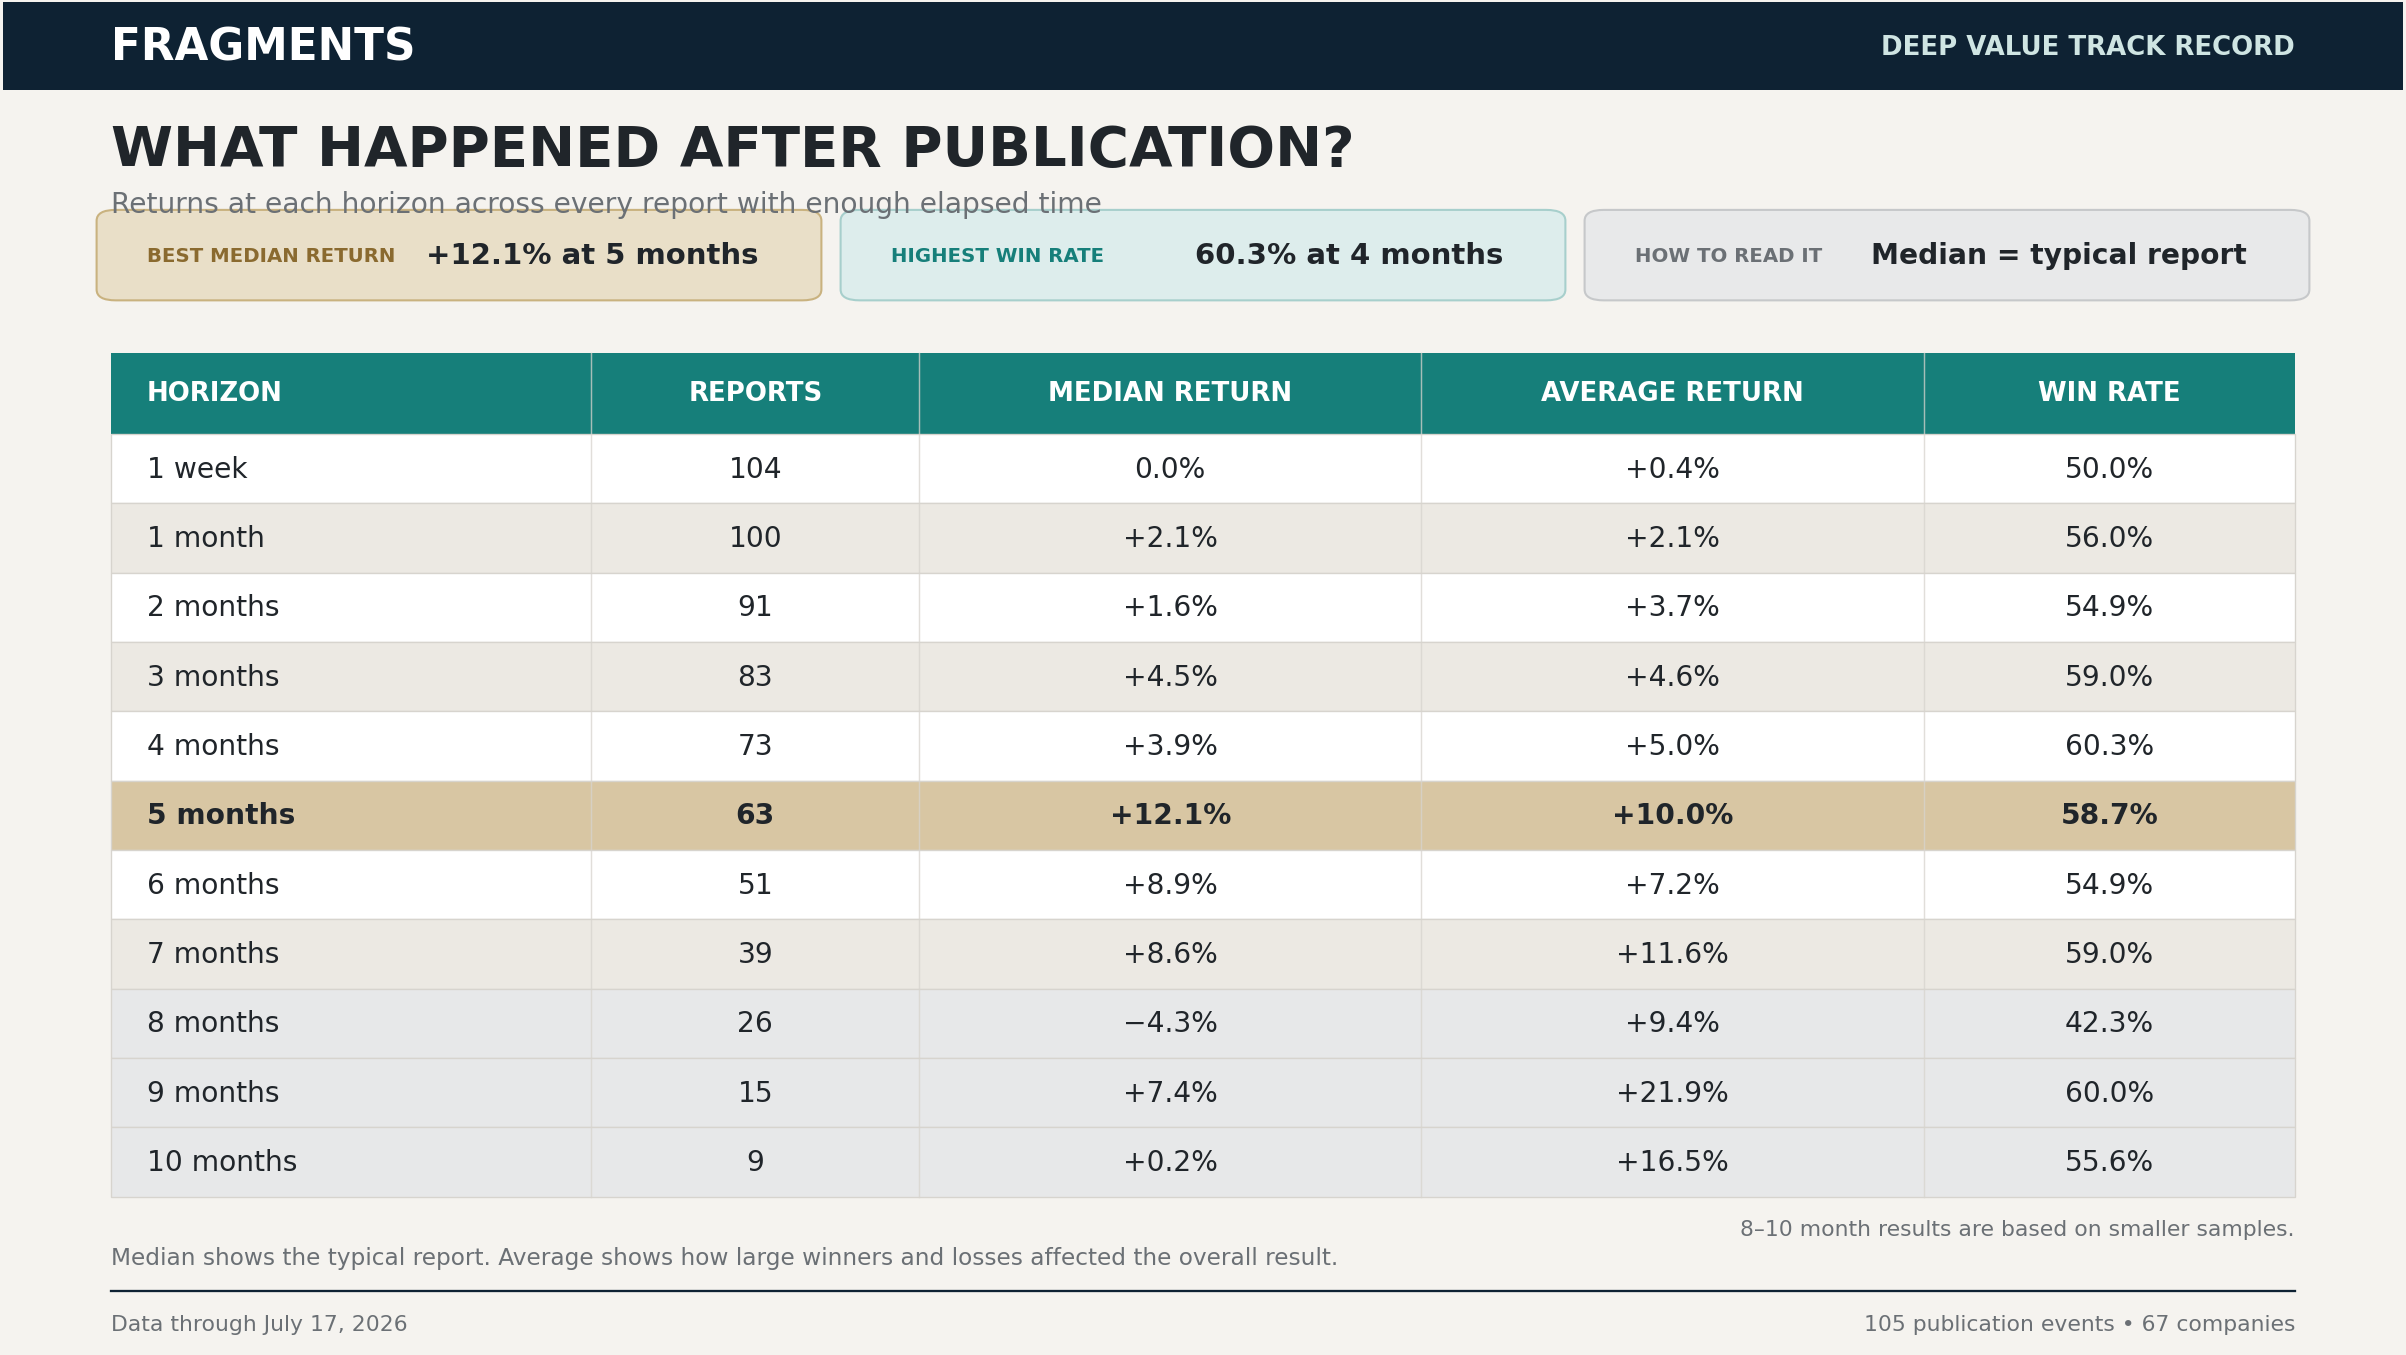
One week was too soon to tell. The better results only showed up after a few months. At five months, the median report was up 12.1%. The highest win rate came one month earlier, when just over 60% of the reports were positive.
The record becomes thinner beyond seven months. Only 26 reports had reached the eight-month mark, and even fewer had reached nine or ten months. The weaker result at eight months may eventually prove important. For now, the sample is too small to know whether it reflects the lasting value of the research or simply the quality of the earliest group of companies.
Most of the better results appeared between months three and seven. These companies usually needed time.
A cheap company can remain cheap while investors wait for evidence: a refinancing, an asset sale, improving cash flow, a better quarter, a management change or proof that the feared disaster will not occur.
Finding the discount was only the first part. Waiting for the market to recognize it often took much longer.
The Winners Carried the Record
Across all 105 publication events, the median return through July 17, 2026, was +4.2%. The average return was much higher, at +12.3%, and just over 54% of the reports were positive.
A 54% win rate is ordinary. It barely clears half. The size of the winners changed the outcome.
The average winning report gained approximately 38.9%. The average losing report declined approximately 19.3%. The winners were roughly twice as large as the losers.
A few companies underwent full repricings:
Hudson Pacific Properties: +159.4%
Centene: +124.3%
American Outdoor Brands: +115.3%
Xerox: +97.9%
Chatham Lodging Trust: approximately +97% on two publication events
Those moves did not come from predicting the next quarter perfectly. They came from situations where the market had already priced in a great deal of permanent damage. Once the outcome proved less severe, the business did not need a miraculous recovery. The original pessimism simply became too extreme.
The five best publication events generated almost half of the cumulative net gain. The ten best generated roughly three-quarters.
A small number of very large winners did much of the work. Most deep-value ideas will never become spectacular. Some produce modest gains. Others remain dead money. A few fail badly. The process depends on finding enough situations where the upside can become several times larger than the loss when the thesis breaks.
The result did not come from being right unusually often. It came from making much more on the strongest ideas than was lost on the average mistake.
Cable One, Mercer—and the Danger of Familiarity
The winners were pleasant to review. The repeated losses were harder.
Cable One produced the worst result in the database, declining 75.6% from one publication date. Other CABO reports also fell by more than 60%. Mercer International produced several losses of similar magnitude.
These were not six unrelated mistakes scattered across different companies. They were repeated publications built around two familiar theses.
Once you have spent weeks researching a business, familiarity begins to feel like knowledge. You understand the assets. You know management’s language. You have read the debt documents, listened to the calls and built the valuation.
Then the stock falls again.
A lower price can make the opportunity look even better. Sometimes it is better. Sometimes the business has weakened faster than the discount has grown.
Familiarity also makes it easier to fit new information into the old story. Revenue weakness becomes temporary. A refinancing problem remains manageable. Another guidance cut becomes one more reason the market is being irrational.
The spreadsheet does not care how well you know the company.
Reports on companies covered only once produced a median return of approximately 10.7%, with 59.1% positive. Reports involving repeatedly covered tickers produced a median return of only 1.4%, with 50.8% positive.
CABO and MERC had a large influence on the gap, so I would not conclude that every follow-up report is inferior. An update can be extremely valuable when the facts have genuinely improved. The pattern is still strong enough to change the process.
A second or third report on the same company cannot begin with the original thesis. It has to begin with the possibility that the original thesis was wrong.
What has deteriorated? Which assumption no longer holds? Has the debt moved from uncomfortable to dangerous? Is the discount growing because the market is impatient, or because the assets are worth less than I thought? Would I still begin the research today if I had never studied the company before?
Those questions have to come before another valuation table.
Where This Leaves Me
The published ideas have produced a positive median return. The stronger results generally appeared several months after publication. The win rate was ordinary, but the winners were large enough to carry the record.
I cannot yet claim that the reports beat the market.
The database measures stock returns after publication. It does not represent a portfolio with equal position sizes, automatic purchases or a fixed selling rule. Dividends are excluded. Several companies appeared more than once, which means the 105 publication events are not 105 fully independent ideas.
The analysis also measures absolute returns. It does not yet compare every report with the Russell 2000, Russell 2000 Value, the S&P 500 or the relevant industry group over the same period.
A stock gaining 12% during a 25% market rally may not have created alpha. A stock falling 5% while its industry collapsed 30% may have performed far better than the raw number suggests.
Those comparisons come next, along with maximum drawdown, first reports against later updates and the role balance-sheet strength played in the outcome.
The most useful lesson is already visible.
I need to be patient with unfamiliar opportunities and more suspicious of familiar ones. Every new report will continue entering the database. Every follow-up on an existing company will begin by trying to destroy the earlier thesis, not defend it.
The first 105 reports changed how I think about the work.
The winners rewarded patience. The worst losses punished attachment.
Both belong in the record.
Paid subscribers receive every new Deep Value Report, the complete valuation work behind each thesis, and the follow-up analysis when the facts change.
Good for you on the audit. This was really interesting. I imagine you deserve to include those dividends as that is real return. Maybe I misread that part. Great work. Keep up the quality.
Really appreciate this kind of analysis. I bought MERC after reading your report. Small position, but obv has been a disaster. I’m OK with mistakes but only if someone comes clean. Thank you